Texas Floods July 2025
Following catastrophic flooding in Texas Hill Country, NASA supported response agencies with satellite and airborne data to assess flood extent and aid search and rescue.
Overview
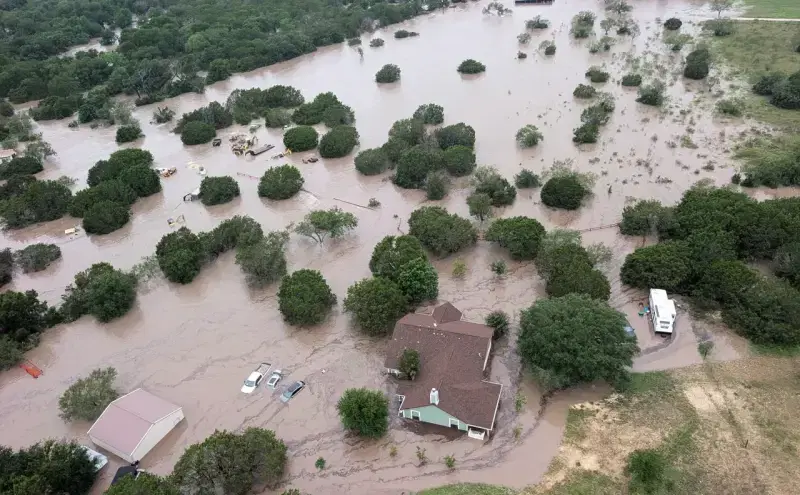
Beginning July 4, 2025, torrential rainfall from the remnants of Tropical Storm Barry triggered catastrophic flooding across Texas Hill Country, particularly in Kerr County as the Guadalupe River rose rapidly. The floods caused significant loss of life, widespread property damage, power outages, and prompted hundreds of emergency rescues.
The NASA Disasters Program activated to support the Texas Department of Emergency Management, FEMA Region 6, and the non-profit Save the Children. NASA deployed two aircraft over the San Gabriel and Colorado river basins, collecting high-resolution optical imagery to support search and rescue operations, and UAVSAR radar imagery to identify flooded regions when clouds and trees obscured other sensors. NASA also shared satellite precipitation data, landslide risk assessments, and infrastructure impact analyses to help guide responders in deploying resources.
Finding the Floods
When flooding struck Texas Hill Country, NASA deployed two specialized aircraft to give responders a clearer picture.
Explore the UAVSAR Flood Maps
Event Data Gallery
View all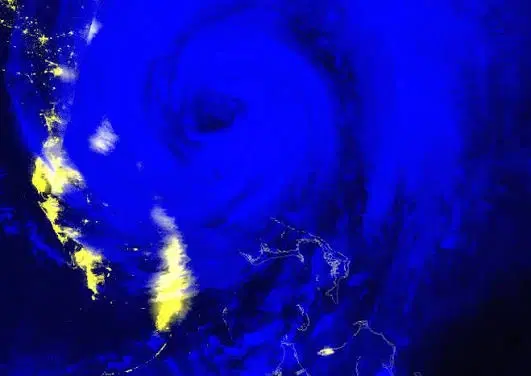
Black Marble Nighttime Blue/Yellow Composite
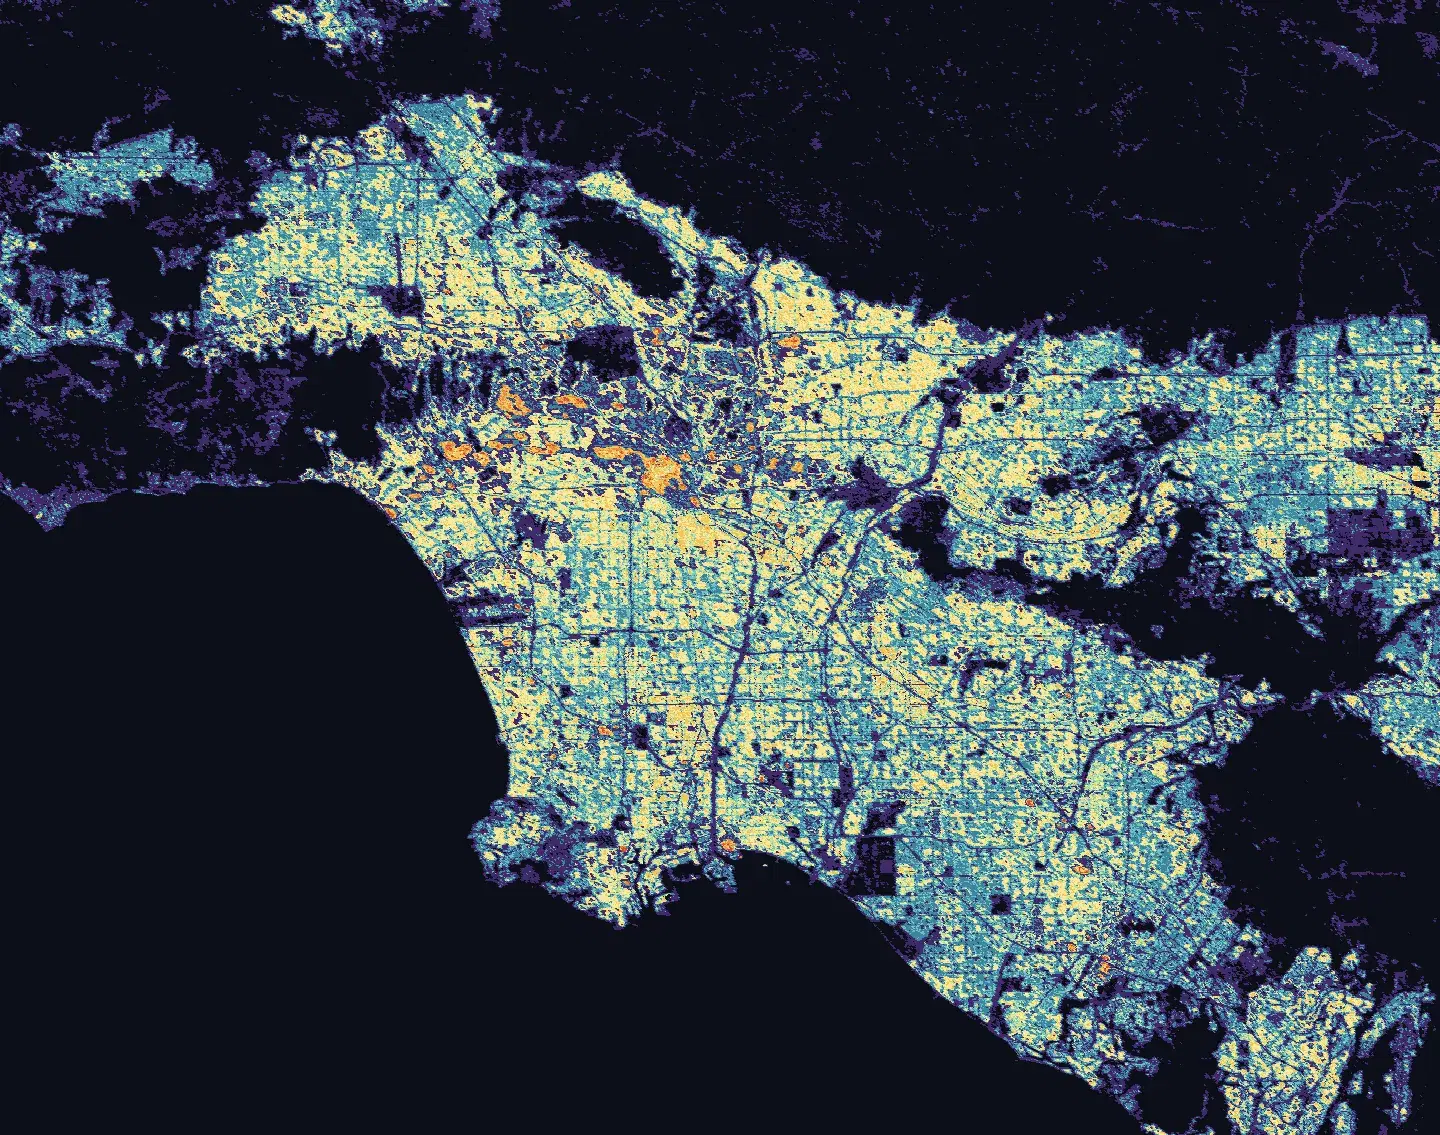
The Black Marble Nighttime Blue/Yellow Composite uses VIIRS nighttime observations to visualize artificial lights, fires, and clouds, supporting assessment of potential power outages and other disaster impacts.
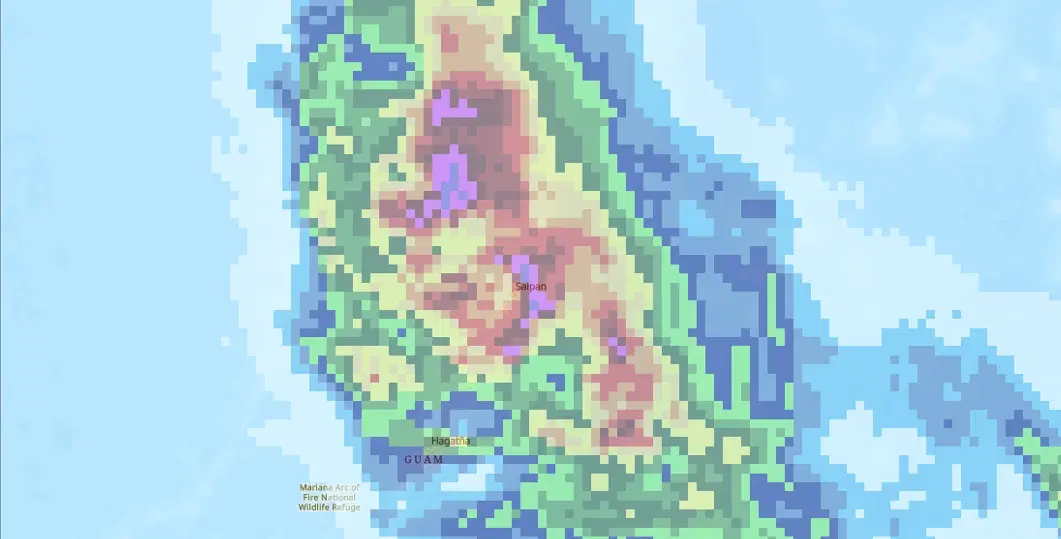
GPM IMERG Accumulated Precipitation
Daily accumulated precipitation from NASA's Integrated Multi-satellitE Retrievals for GPM (IMERG), a near-real-time global rainfall estimate that blends passive microwave, radar, and infrared satellite observations onto a 0.1 degree grid.
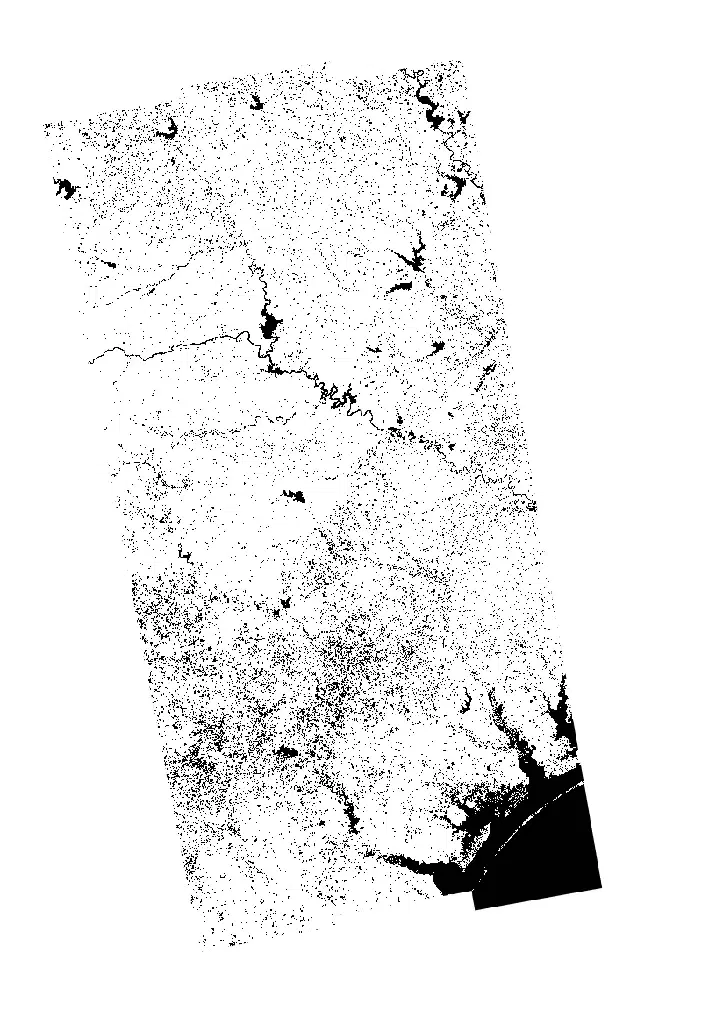
OPERA Dynamic Surface Water Extent (DSWx)
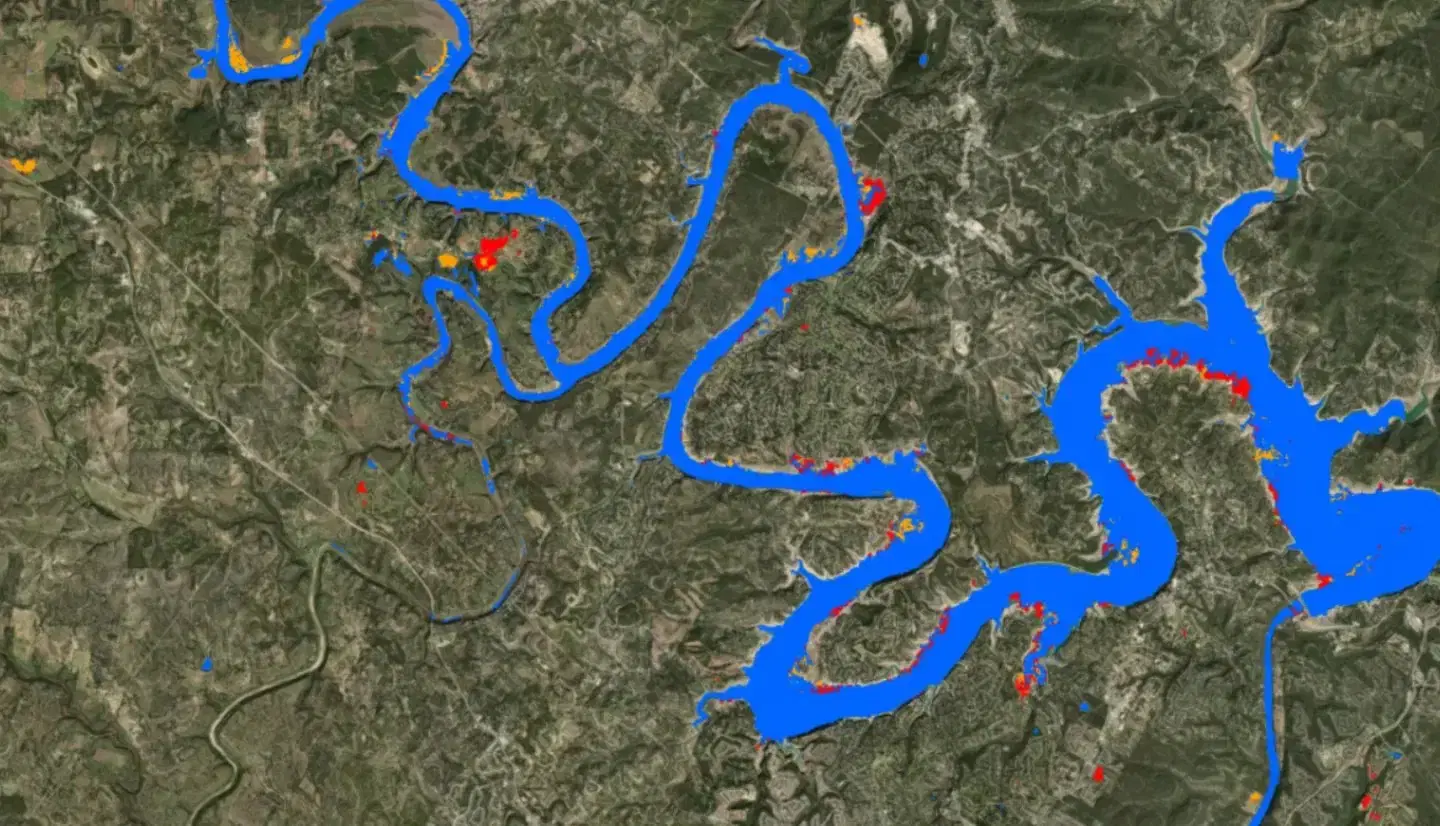
The OPERA Dynamic Surface Water Extent (DSWx) product maps the presence of surface water, derived from both optical Harmonized Landsat Sentinel-2 observations and Sentinel-1 synthetic aperture radar, to support flood mapping and monitoring of open water.
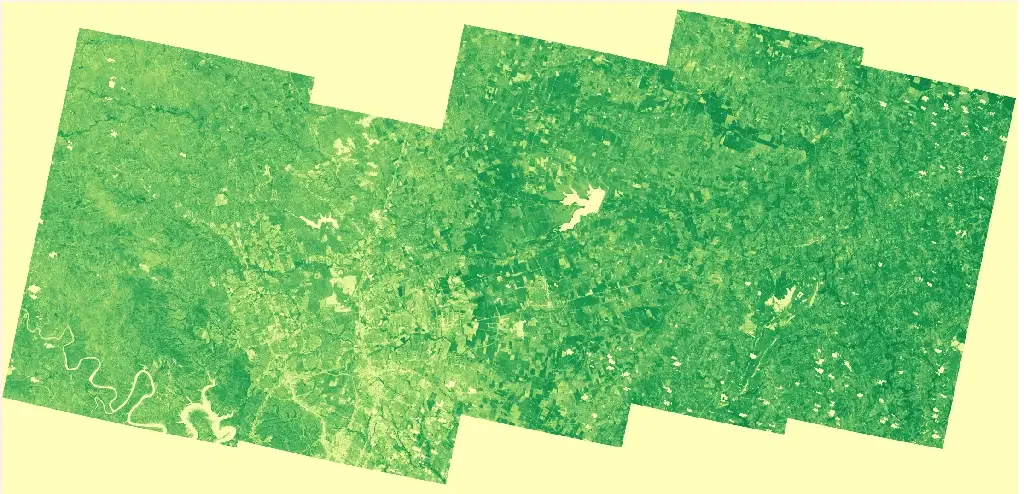
Planet Normalized Difference Vegetation Index (NDVI)
Normalized Difference Vegetation Index (NDVI) derived from PlanetScope observations, using near-infrared and red reflectance to indicate the presence and relative condition of green vegetation at high spatial resolution.
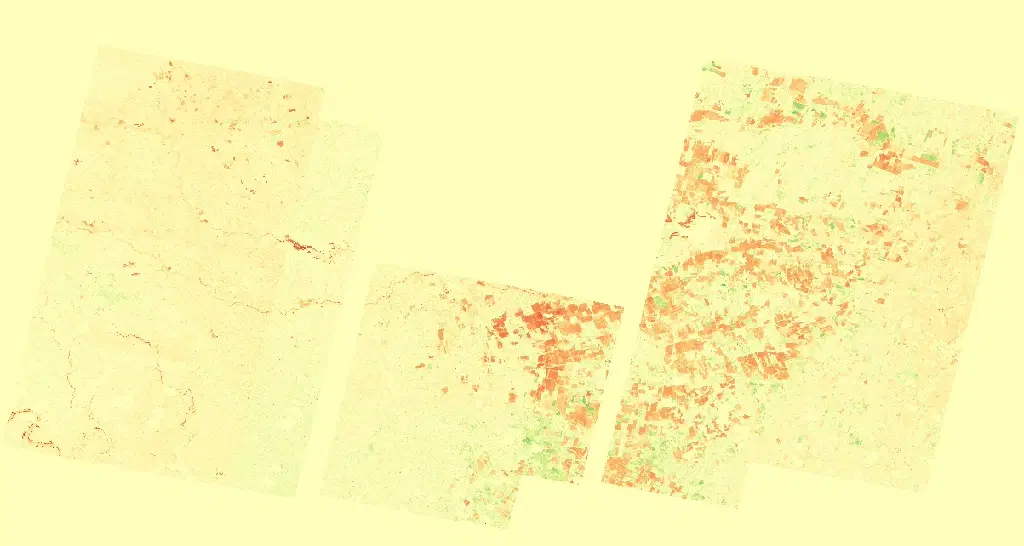
Planet NDVI Change
Change in Normalized Difference Vegetation Index (NDVI) between two PlanetScope acquisitions, highlighting where vegetation has been lost, stressed, or has recovered between a pre-event baseline and a later observation.
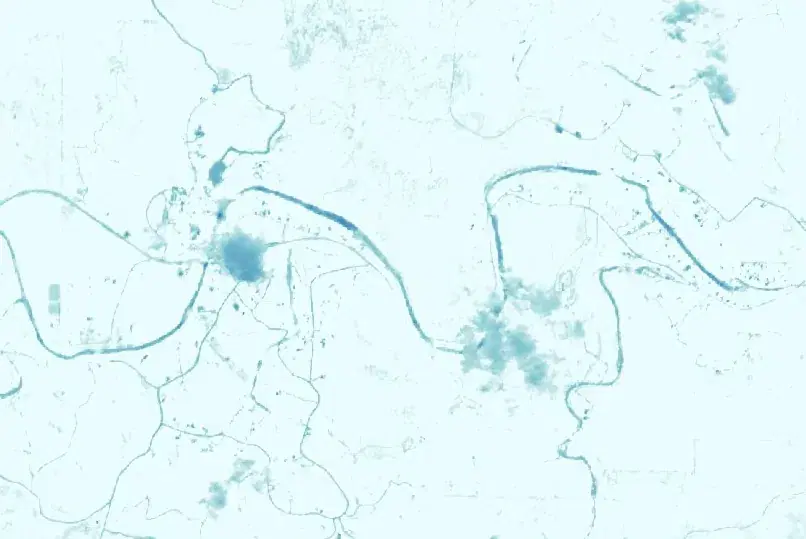
Planet Normalized Difference Water Index (NDWI)
Normalized Difference Water Index (NDWI) derived from PlanetScope observations, using green and near-infrared reflectance to highlight surface water and water-related changes at high spatial resolution.
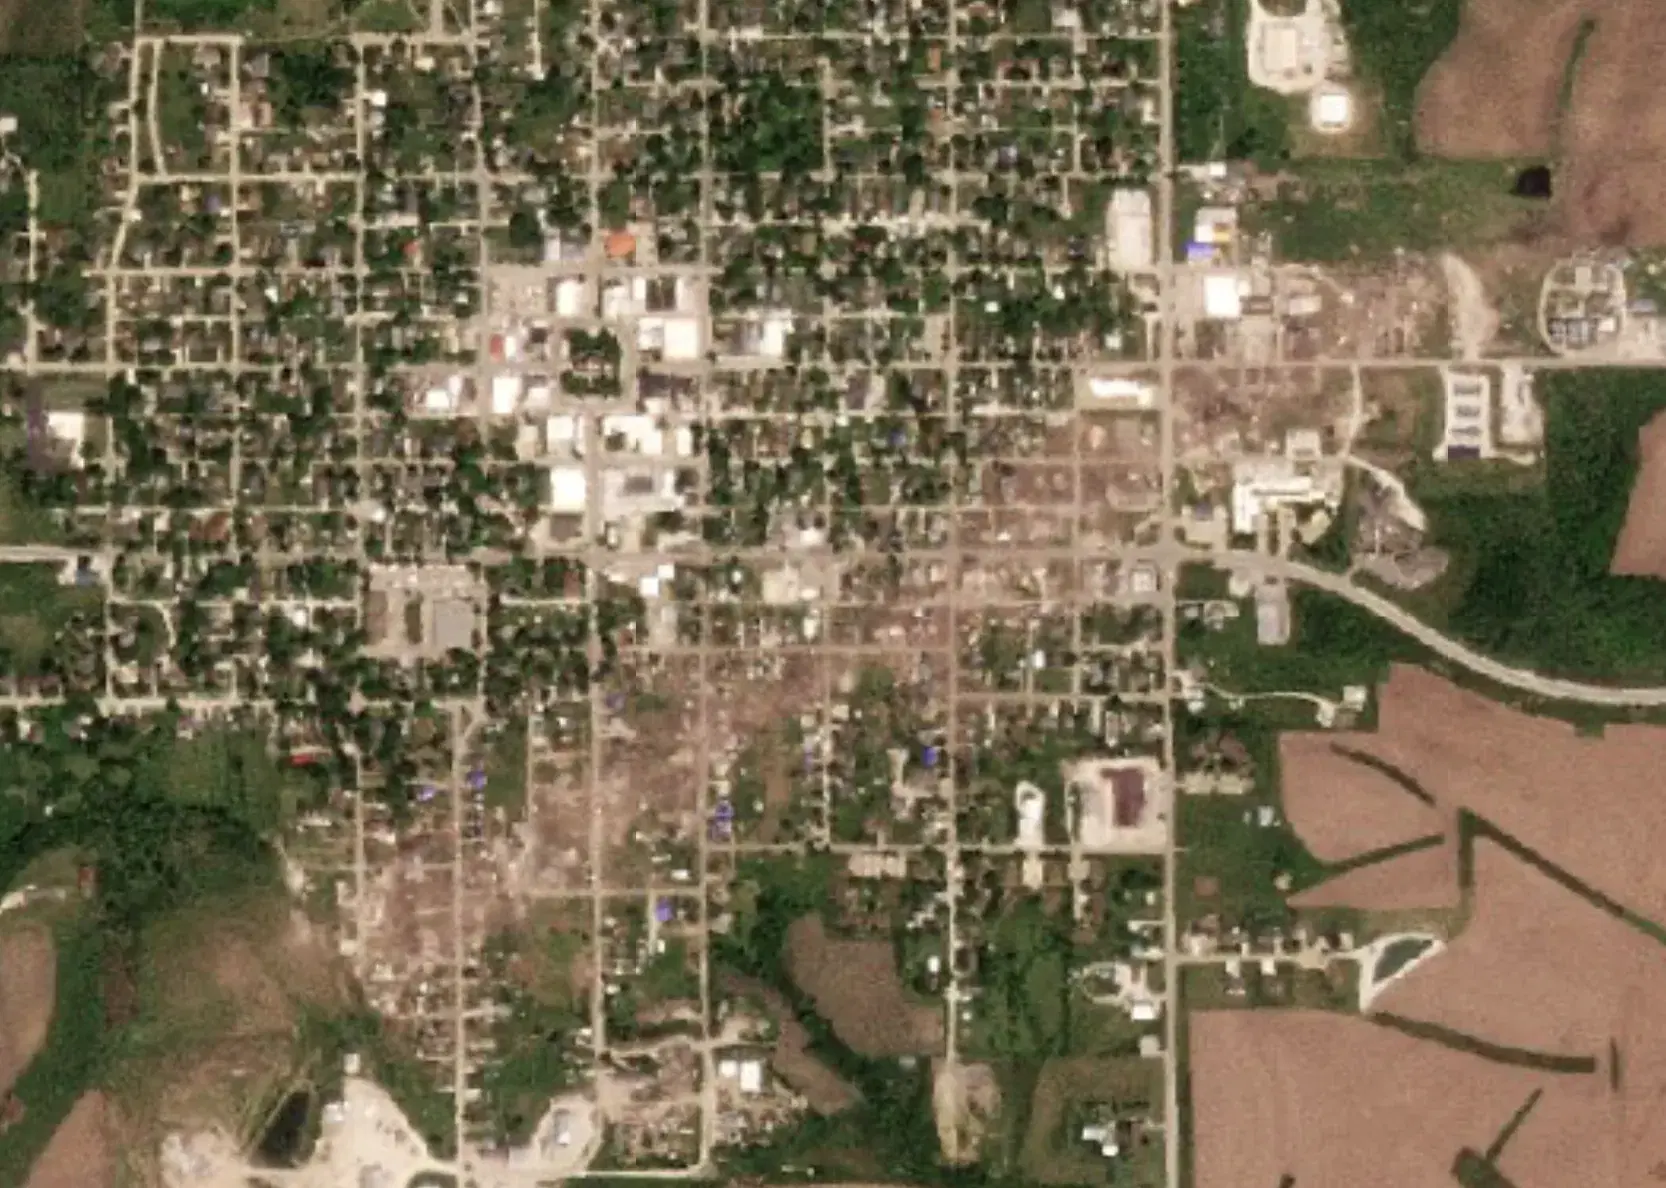
Planet True Color Imagery
Planet True Color imagery combines red, green, and blue PlanetScope observations to provide a high-resolution, natural-looking view of the Earth's surface for disaster response and assessment.

Sentinel-2 Color Infrared Imagery
Created using near-infrared, red, and green channels to highlight vegetation, water, burned areas, and other surface changes associated with floods, fires, and other hazards.

Sentinel-2 True Color Imagery
A visible-light composite created from Sentinel-2 red, green, and blue observations to show the Earth's surface approximately as it would appear to the human eye from space.
UAVSAR U-Net Flood Classification
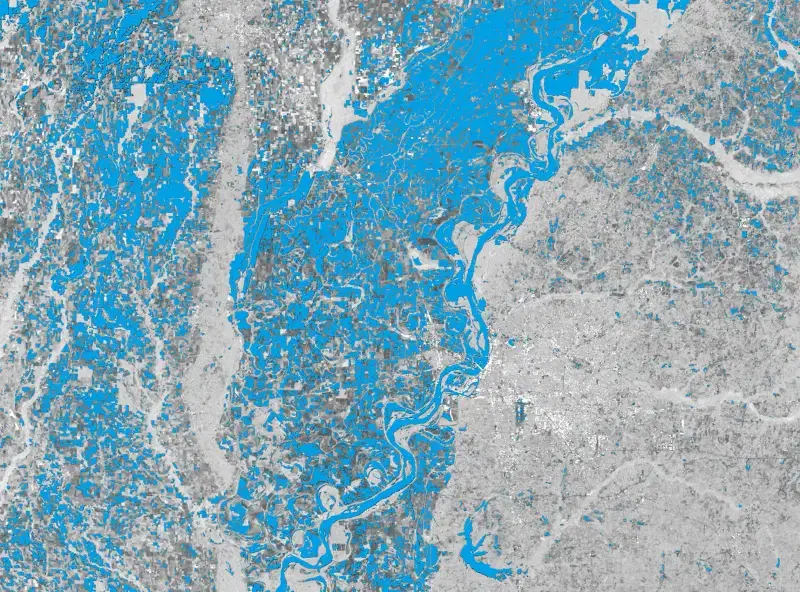
Machine learning flood maps derived from UAVSAR polarimetric radar using a U-Net algorithm, identifying open water flooding and inundation beneath tree canopy and labeling the type of land cover that was flooded.
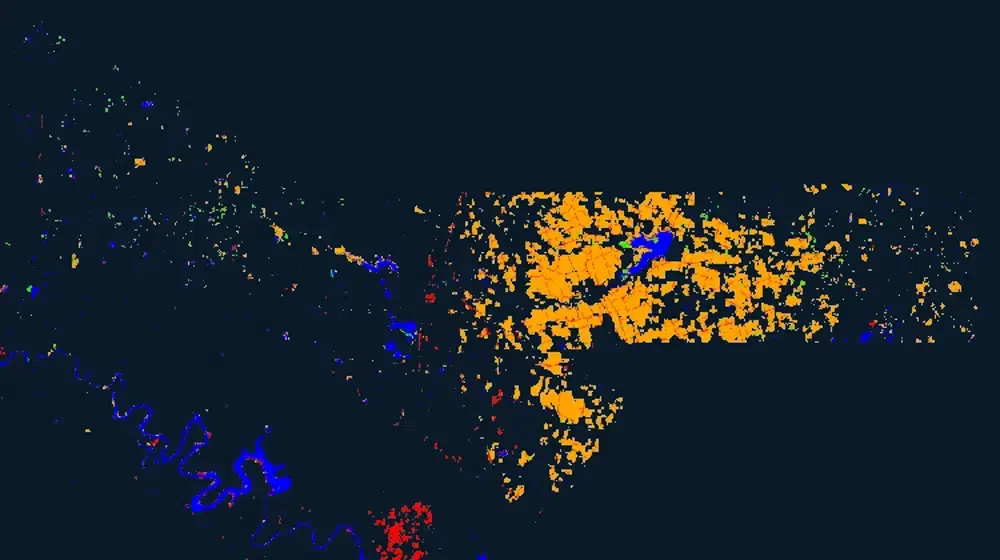
UAVSAR U-Net Flood Classification (Grayscale)
A single-band grayscale rendering of the UAVSAR U-Net flood classification, intended for use as an analysis-ready input layer or as a neutral underlay beneath other thematic map layers.
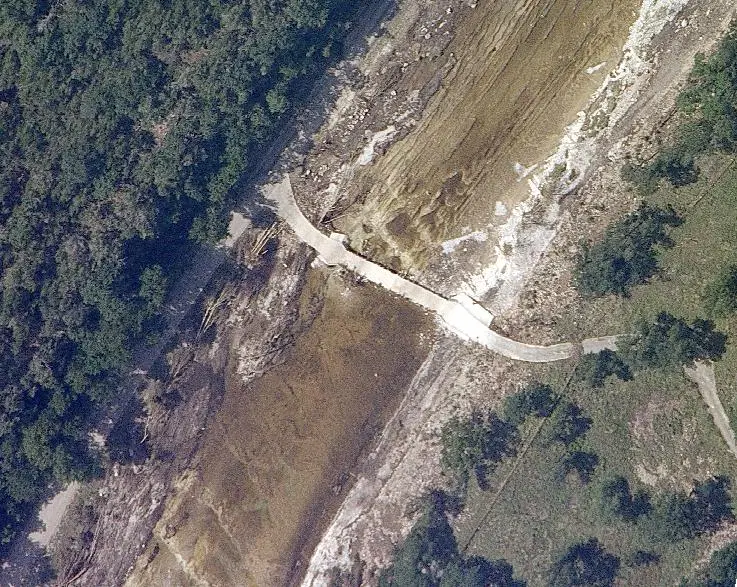
WB-57 DyNAMITE Airborne Imagery
High-resolution visible and infrared imagery collected by the DyNAMITE instrument aboard NASA's WB-57 high-altitude aircraft, streamed to responders during flight.