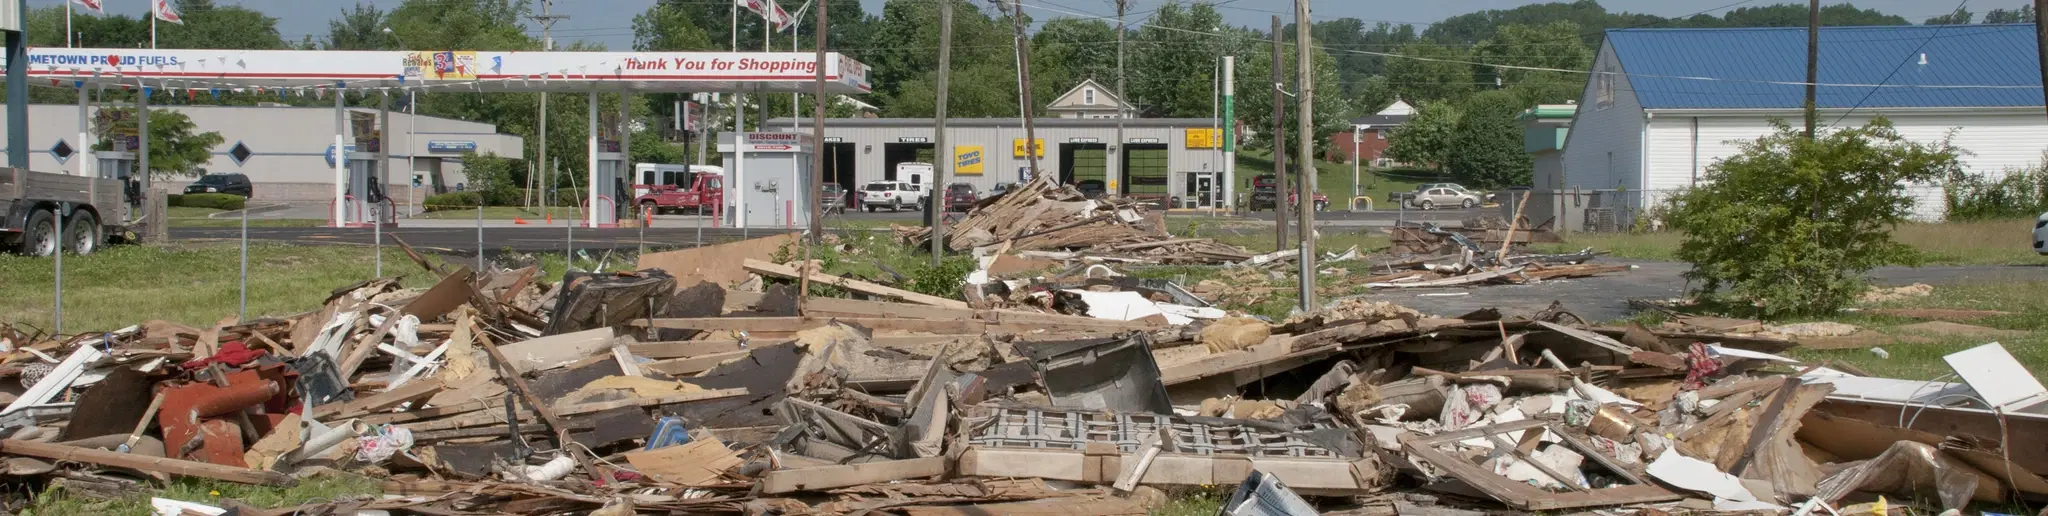
Debris removal operations along 6th street in Mayfield, Kentucky, Feb. 8, 2022. The Louisville District was working under the direction of FEMA at the request of the state and local government to perform debris removal in Graves County. Credits: Katelyn Newton / U.S. Army Corps of Engineers, Louisville District.

Recover

Assess impacts and rebuild stronger

Data Visualization

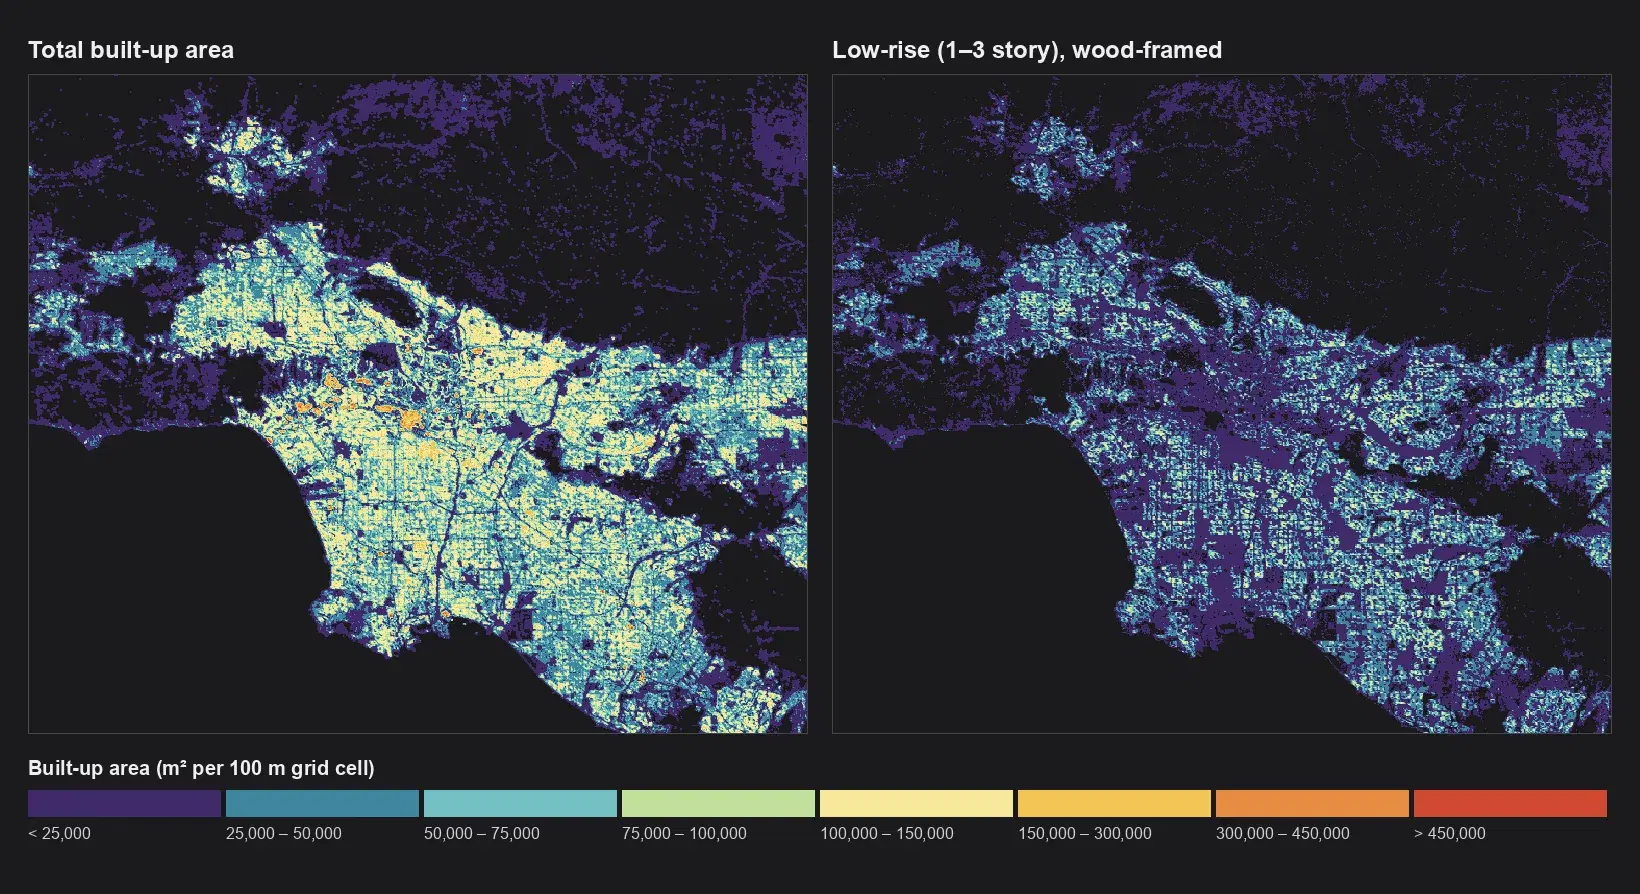
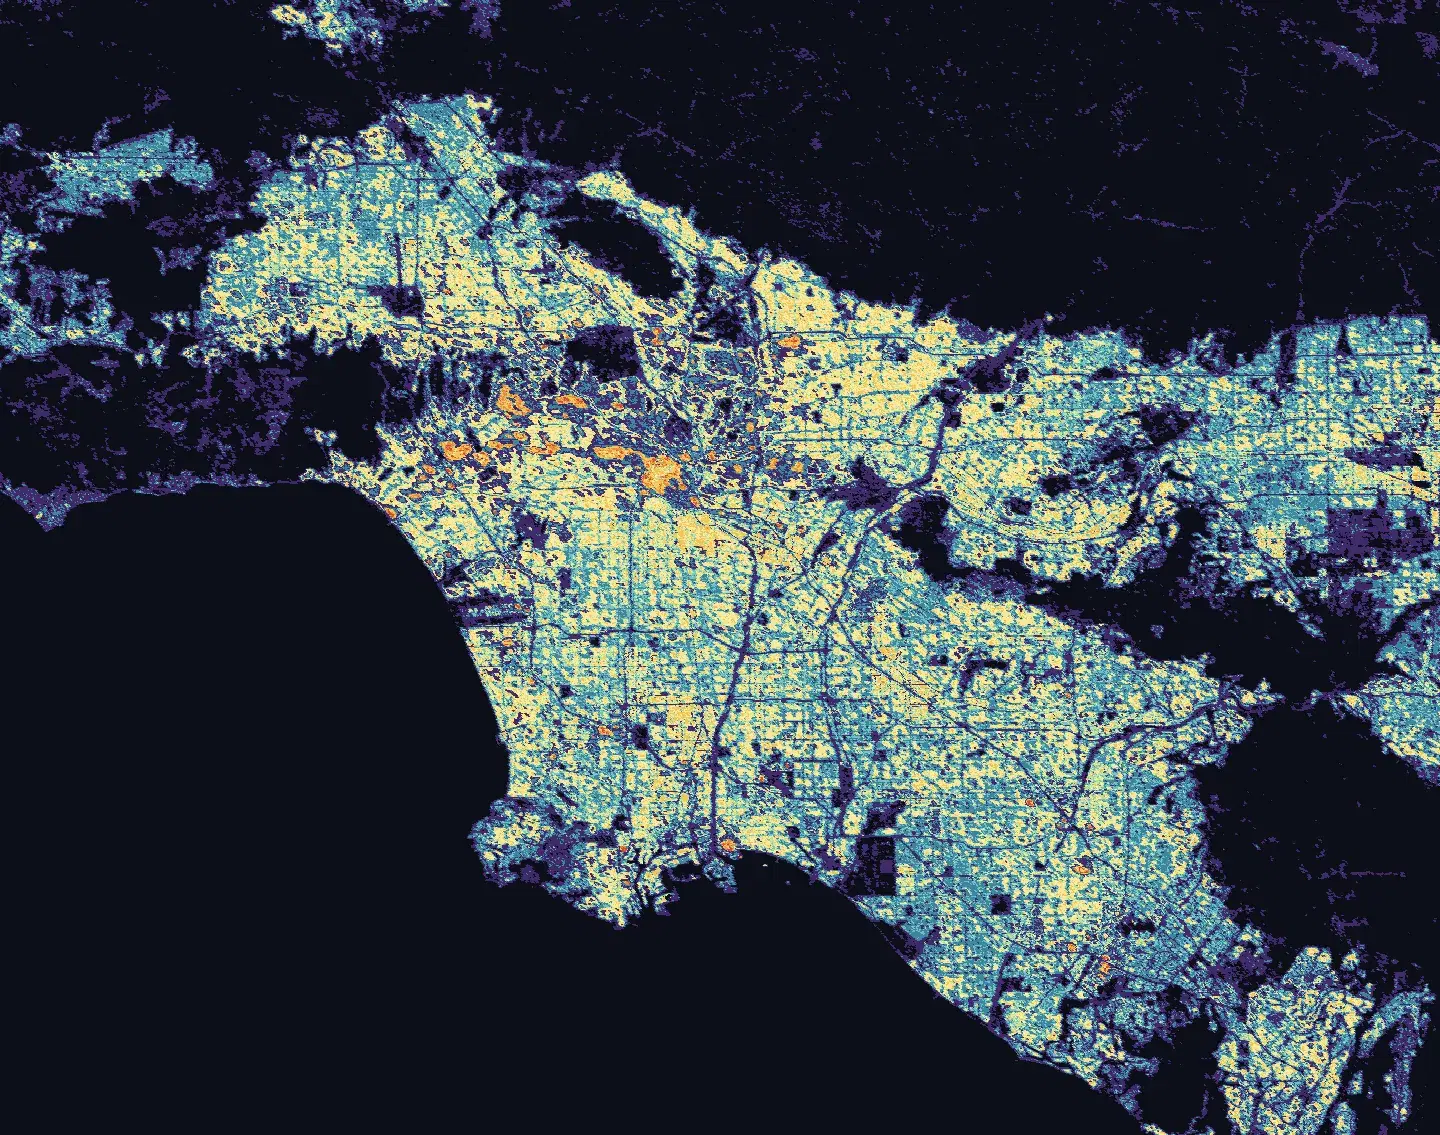
Two side-by-side maps of the Los Angeles basin from the GAIA dataset. The left map shows total built-up area per 100-meter grid cell, densest through the urban core. The right map shows only low-rise, wood-framed structures, which are sparser and more evenly spread across the suburbs. A legend gives the eight built-up area classes, from under 25,000 to over 450,000 square meters.
The Global Assessment of Infrastructure Assets (GAIA) is a worldwide gridded building exposure dataset suitable for natural hazard risk analysis. The dataset provides a gridded representation of built-up areas worldwide in square meters. At each pixel, the value is a modeled value that represents total built-up area for the grid cell. It does not represent actual buildings in the grid cell. The left image is the total built-up area which aggregates all construction types, durability types, and height categories per grid cell. The right image shows the amount of low-rise (1-3 story), wood-framed structures per grid cell. Each 100x100 meter grid cell represents the total area in square meters.