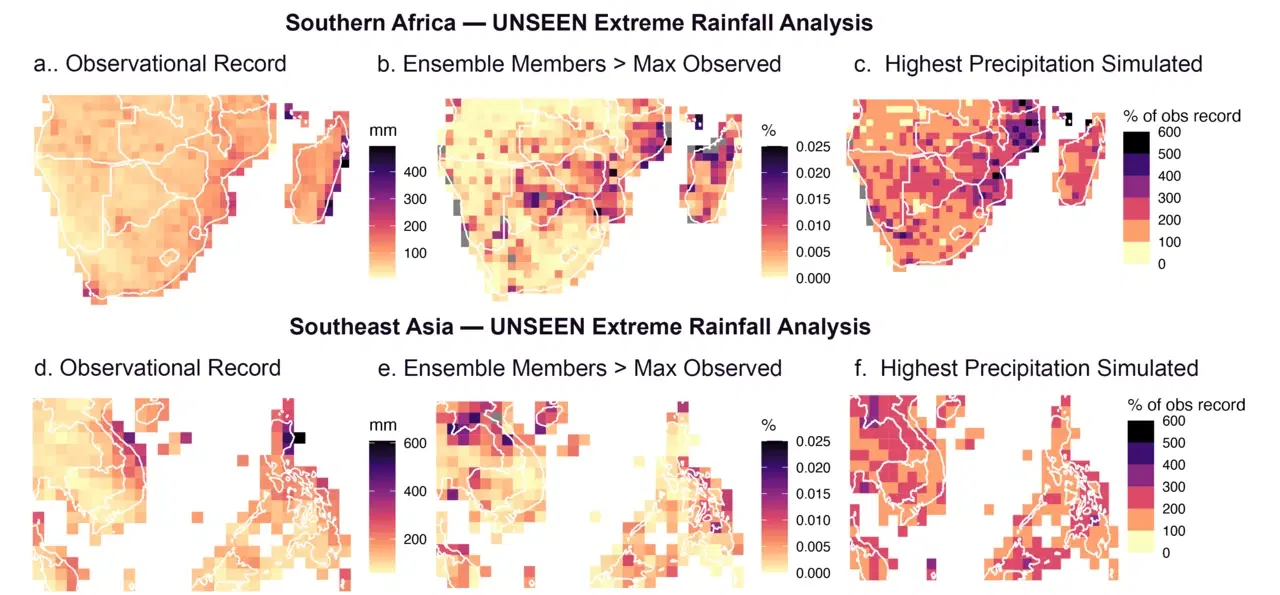
These maps compare extreme rainfall observed from 1981–2024 with modeled rainfall generated using the UNprecedented Simulated Extreme ENsemble (UNSEEN) approach for Southern Africa (top) and Southeast Asia (bottom). The left panels (a & d) show the highest observed one-day rainfall; the middle panels (b and e) show how often UNSEEN simulations exceeded that historical maximum; and the right panels (c and f) show how much larger the most extreme simulated rainfall was compared with the observed record. In several areas, the simulations produce record-breaking rainfall — and in some locations, amounts several times greater than anything in the observational record. These gaps reveal places where history may provide an incomplete picture of present-day risk, helping scientists and disaster managers develop realistic scenarios to stress-test plans and prepare for extreme events communities have not yet experienced. Credit: NASA Disasters Program; Erin Coughlan de Perez.