
Respond
Support real-time decisions with timely insights
Stories of Impact
More Stories of Impact
Data Visualization
Mar 2019
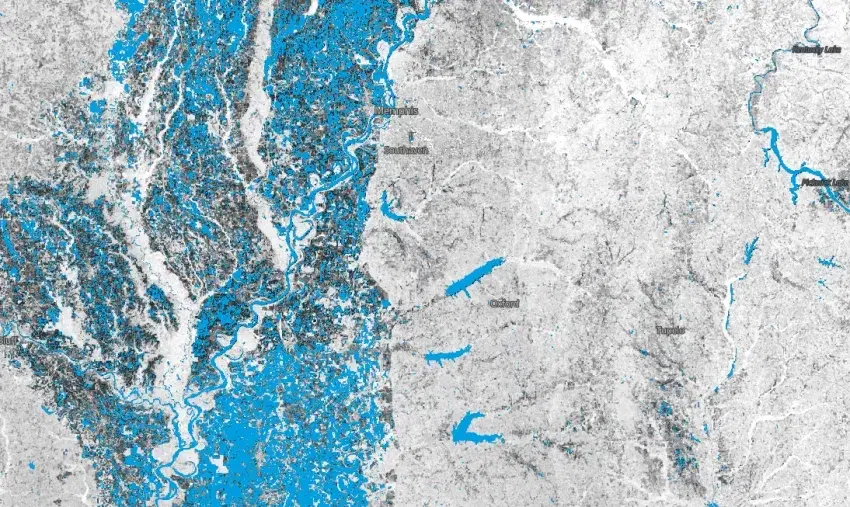
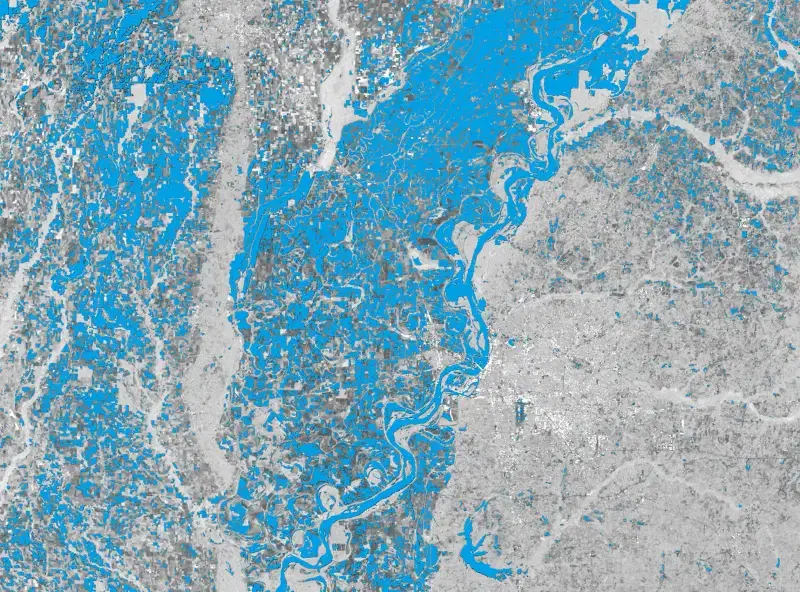
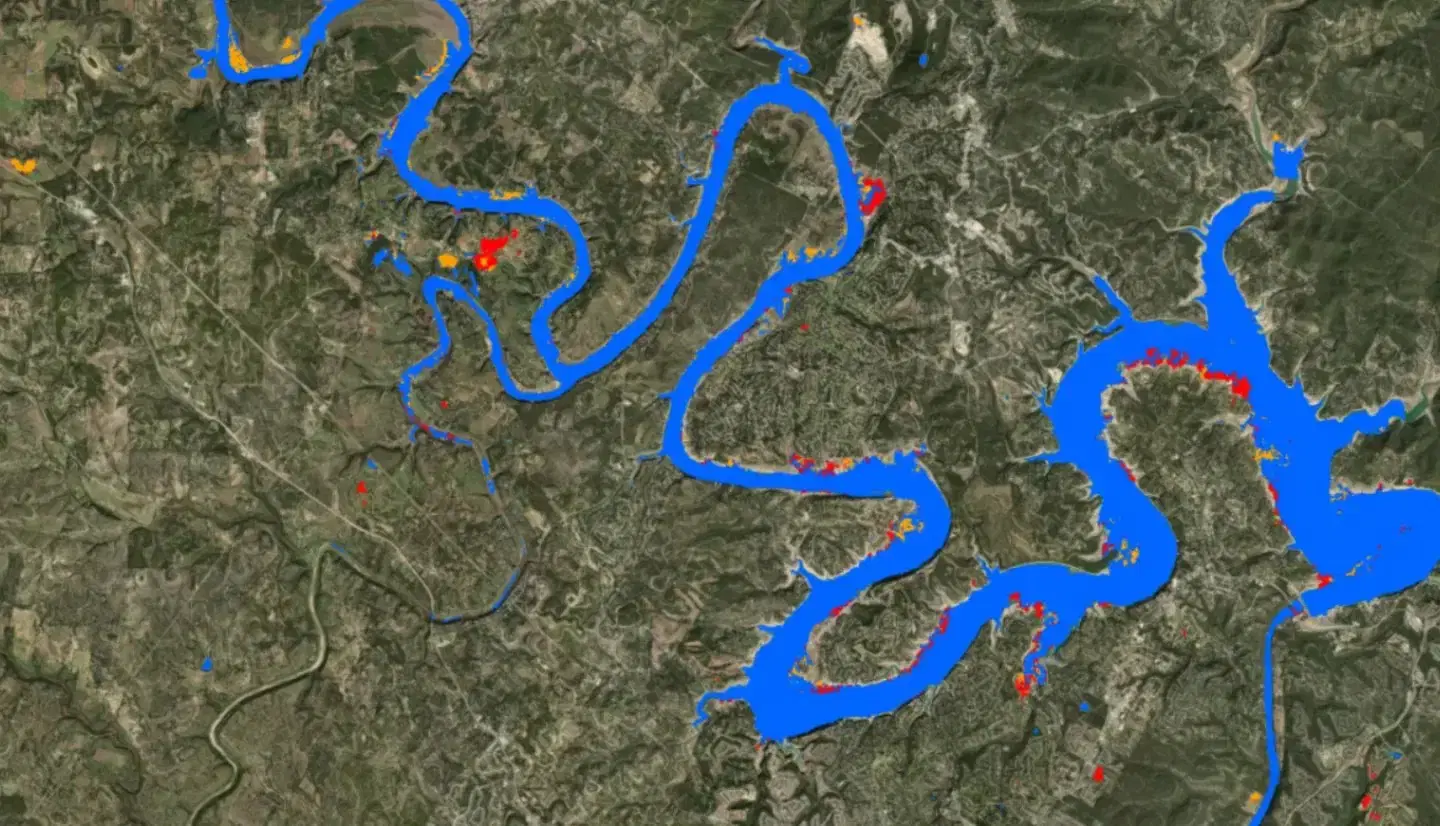
The midwestern United States was greatly impacted by flooding during Spring 2019. This visualization shows how flooding can be detected using moderate resolution Copernicus Sentinel-2 imagery, comparing a True Color composite from Sentinel-2 imagery on the left with a Modified Normalized Difference Water Index (mNDWI) product derived from Sentinel-2 imagery on the right. In the mNDWI product, likely water appears as blue.