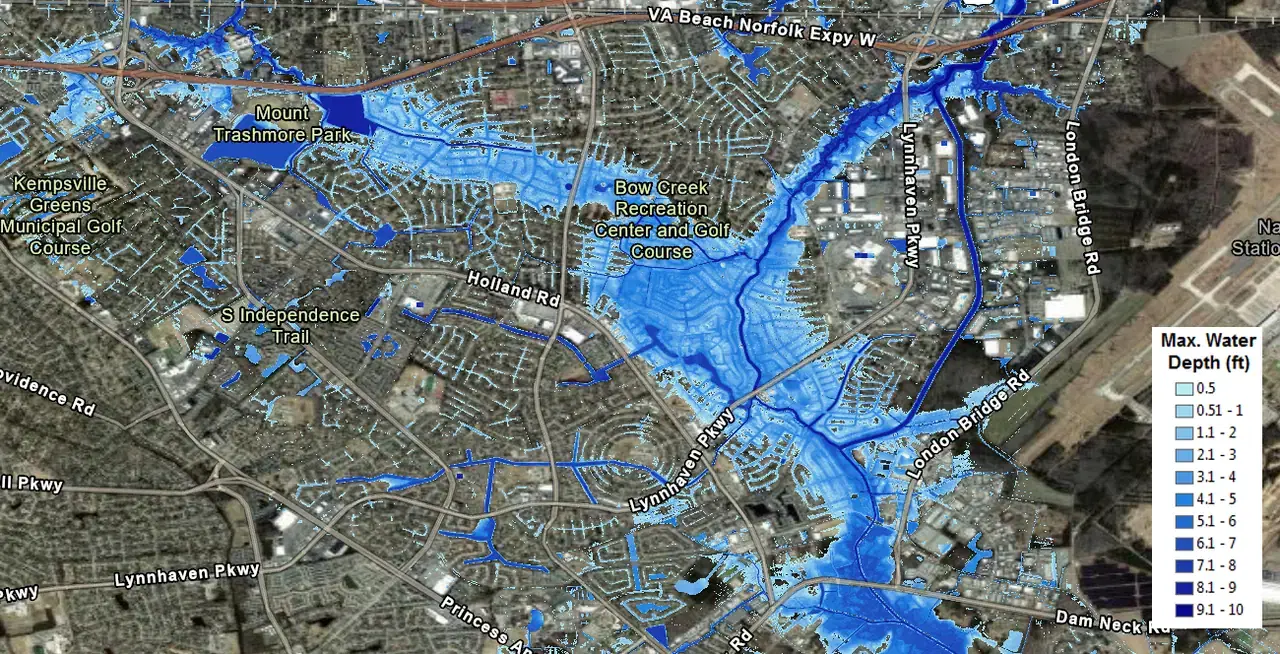
This map shows the modeled maximum flood extent and water depth in central Virginia Beach during Hurricane Matthew in October 2016. Using a Virginia Institute of Marine Science (VIMS) street-level inundation model, researchers can examine how a real storm affected individual streets and neighborhoods, then use that event as a baseline for scenarios exploring how similar storms could produce different flooding as sea levels rise. Those scenarios can help communities stress-test infrastructure and emergency plans before the next major flood. Credit: NASA; J. Derek Loftis, Ph.D., Virginia Institute of Marine Science, William & Mary.