
Understanding EO-based Building Exposure Data
1. Building exposure data: an overview
Explains the purpose of building exposure data, how it is used, and its role in loss estimation. Reviews key stakeholders, use cases, and considerations for responsible application.
Recommended for: Educators, facilitators, planners, policymakers, emergency managers, GIS analysts, engineers, and researchers
1.1 What is building exposure data?
Explains the purpose of building exposure data, how it is used, and its role in loss estimation rather than as an end product. Clarifies that it is not building rendering data, but gridded building characteristics used for loss estimation. Presents examples to ground these ideas and introduces the key concepts of construction type, replacement cost, and building area.
1.2 From building exposure to decisions
Explains the use of loss estimation and CAT modeling to support decisions from planning and quantification to immediate response and recovery. Presents exposure as a key factor, along with vulnerability and hazard, in assessing risk. Reviews key stakeholders such as NGOs, insurers, and governments and presents common uses for each. The benefit of more accurate exposure data is presented as a tool to reduce uncertainty, leading to opening of insurance markets and stabilizing economies. An assessment of strengths, weaknesses, opportunities and threats (SWOT) introduces some important considerations.
1.3 Practical illustrations
Reviews two examples of building exposure data in use. One focuses on the Nepal earthquake, identifying distribution of casualties and impacts to support UNICEF outreach. The other covers a congressionally mandated study estimating the cost-effectiveness of mitigation efforts, with findings that inform national policy and funding decisions.
1.4 GAIA — The Global Assessment of Infrastructure Assets
Presentation of GAIA, a global, gridded representation of the built environment. Highlights different attributes and discusses their utility.
1.5 Levels of exposure data development
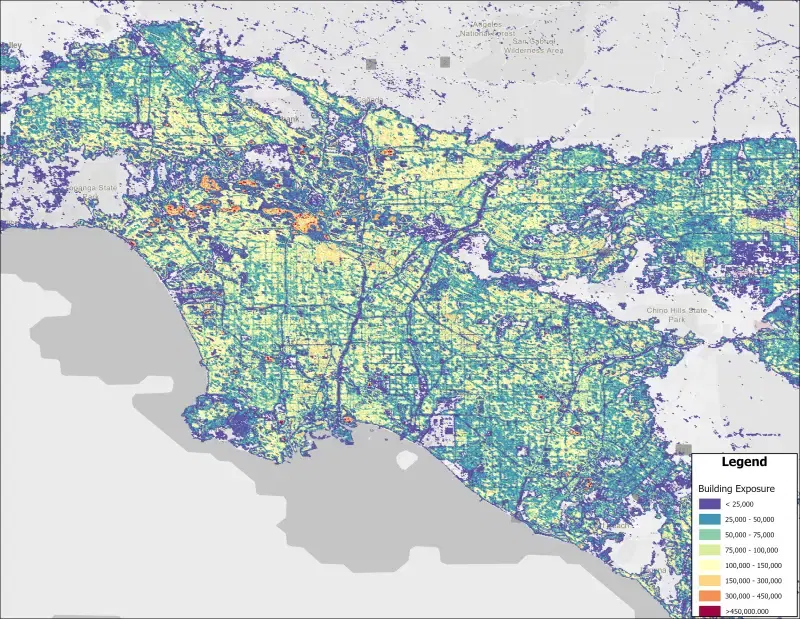
Introduces the five levels of building exposure data and why raw GIS data cannot be used directly without significant processing. Shows how the development approach scales from global and national estimates down to aggregated and building-specific inputs, depending on the application. Uses Los Angeles to illustrate differences in visual resolution among these levels.
1.6 Brief overview of exposure data development
Presents the process of integrating EO data, expert opinion, surveyed building attributes, and asset distribution (population, building footprint, and replacement cost) to produce a gridded exposure database for loss modeling. Explains the role of EO at a global scale and uses Los Angeles to illustrate how development patterns are used to characterize the built environment. This discussion highlights key challenges in developing exposure data.
1.7 Limits, uncertainty, and how to use the data
Reviews inappropriate uses and decisions alongside appropriate applications. Shows that higher levels of exposure data do not necessarily improve accuracy, often due to overlooked drivers such as replacement cost and building area. Uses research on Los Angeles and Kathmandu to illustrate how key exposure inputs alone can significantly shift estimates.
1.8 Using exposure data responsibly
Traces the insurance origins of loss estimation and examines how this perspective shapes what gets measured and ultimately who benefits. Shows how misperceptions surrounding data quality can influence engineering judgment, leading to unfair use of the results. Acknowledges that modeling can simplify complex conditions, potentially overlooking the synergistic benefits of mitigation activities and the importance of a community perspective. Closes with suggestions to stay aware of potential consequences, advance research, and limit misuse.
2. The building exposure development process
The exposure development process is presented with a more in-depth look at the levels of building exposure data, a step-by-step guide to developing building exposure datasets, and how to ensure their quality.
Recommended for: GIS analysts, engineers, and researchers
2.1 Understanding the levels of exposure data development: an in-depth review
Explains the five-tier hierarchy from global estimates to building-specific data and how the development approach scales with application needs and available resources.
2.2 Making a building exposure dataset: a step-by-step approach
A step-by-step approach for building exposure development is provided using EO data from which development patterns are extracted and classified, correlated with building development patterns which are characterized statistically using expert opinion or sampling strategies, and distributing population, buildings, and replacement cost using various simulation approaches. The process of validation is also discussed.
a) Establishing development patterns
b) Remote sensing classification: Techniques and applications
c) Developing mapping schemes and sampling protocols
d) Example: Costa Rica site surveys
e) Population, buildings, and replacement cost: Sources and challenges
f) Exposure modeling: Simulation approaches
g) Validation: Ensuring quality
3. Case Studies
Use cases illustrate the complexity of decision-making when exposure data is integrated into a project and how emergency managers and planners can use loss estimation tactically.
Recommended for: Planners, policymakers, emergency managers, GIS analysts, engineers, and researchers
3.1 Application to insurance and loss estimation: Tunisia
A demonstration of how exposure data supports loss estimation for insurance applications using an example from the World Bank. Uses Tunisia to illustrate how assets are characterized and losses estimated to inform pricing, underwriting, and risk transfer.
3.2 Infrastructure mitigation from coastal hazards: Antigua and Barbuda
A demonstration of how exposure data supports planning for coastal risk. Uses Antigua and Barbuda to illustrate how infrastructure exposure informs mitigation decisions and investment. Application for in-country risk managers.