When Every Dollar Counts
Estimating Loss to Speed Recovery
Highlights
- The gap between damage maps and recovery decisions is finally being addressed. Traditional loss estimation tools have reliably characterized physical damage and rebuilding costs but quantifying how long economic disruption will last has remained largely out of reach. Two NASA-supported tools now give recovery decision-makers a more complete basis for initial loss assessment.
- A globally consistent building exposure baseline is available for the first time. GAIA, the Global Assessment of Infrastructure Assets, gives emergency managers a purpose-built foundation that can be used alongside other tools and data for disaster loss estimation. GAIA is now available through the NASA Disasters PORTAL and through the EU Joint Research Centre's Human Planet initiative.
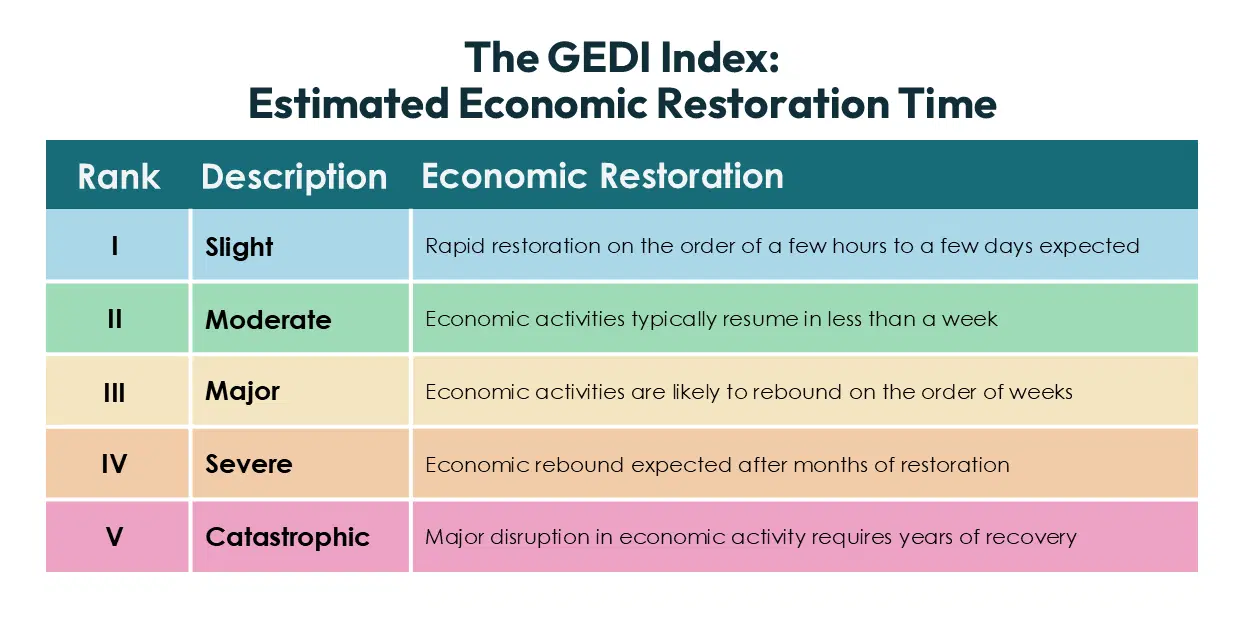
- A new framework for estimating economic recovery time is already in use. The Global Economic Disruption Index (GEDI) predicts how long economic activity will take to return following a disaster, from hours to years, addressing what rebuilding cost estimates alone cannot: how long the disruption will last.
The Question Damage Maps Alone Don't Answer
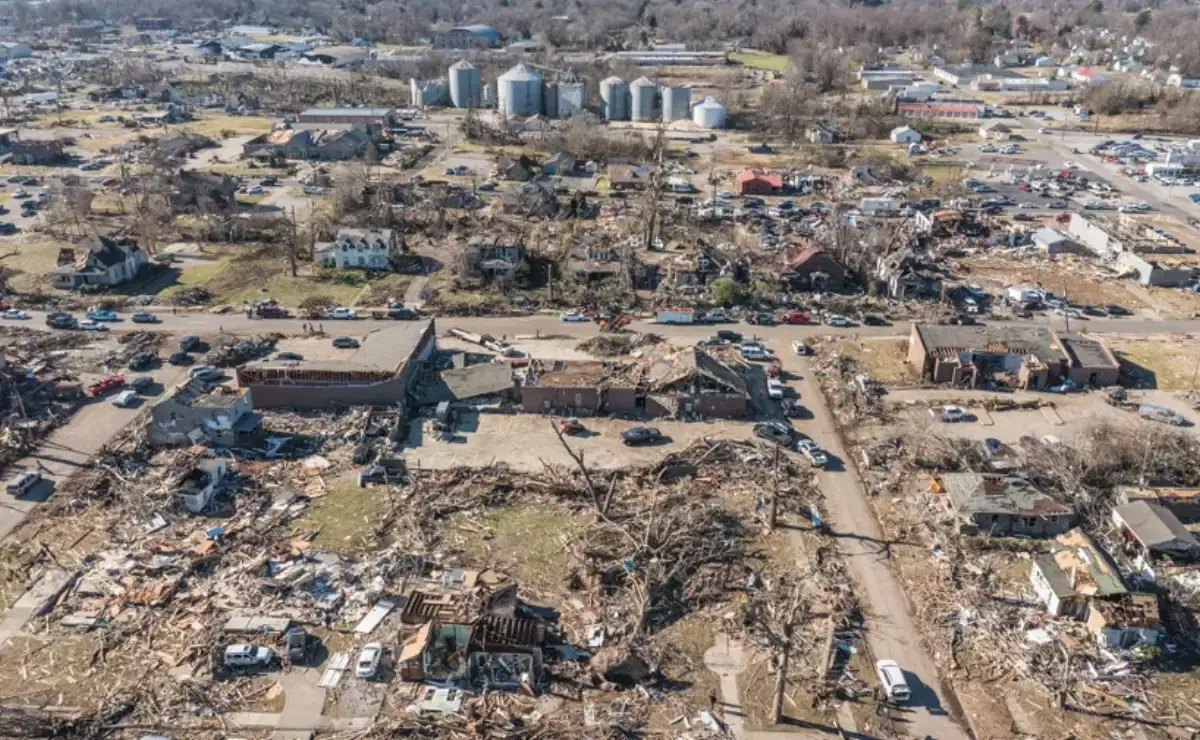
What will it cost to rebuild? How long before things return to normal? For every decision-maker facing a disaster's aftermath – a county official allocating aid, a business owner filing an insurance claim, a homeowner trying to plan what comes next – these questions have rarely had reliable answers. Satellite damage maps show where a disaster struck and how far it reached. They don't show the scope recovery will involve.
In disaster science, consequences are understood across three dimensions: lives impacted, the direct cost of physical damage, and the time required for economic activity to recover. Loss estimation tools have long supported the first two. The third – how long disruption will last – has remained largely out of reach, even as it often determines the true depth of a disaster's impact.
Damage maps can show where disaster struck. What comes next has been much harder to answer.
With support from NASA's Disasters Program, teams at ImageCat have developed two complementary tools designed to bridge that gap – giving decision-makers better information about what existed before a disaster struck and how long its effects are likely to persist. The Global Assessment of Infrastructure Assets (GAIA) provides the first globally consistent building exposure baseline designed specifically for disaster loss estimation, giving recovery planners the foundational data they need to answer what was there and what it was worth. The Global Economic Disruption Index (GEDI) predicts how long economic disruption will last, on a graded scale from hours to years. These research applications promise to give decision-makers something closer to a complete picture at the outset: a gut check before physical assessors arrive, and a basis for the financial and operational decisions that follow.
Turning Satellite Data into Intelligent Recovery
ImageCat, Inc. is a California-based catastrophe modeling firm with a new approach to one of disaster recovery's oldest problems. With support from NASA's Disasters Program, they developed a method for characterizing building exposure that was designed from the ground up for disaster loss estimation, not adapted from data built for other purposes.
Common datasets such as tax records, government inventories, and crowdsourced mapping platforms were created for administrative purposes, not disaster risk assessment, and can introduce systematic bias when applied to loss estimation. Working from their perhaps counterintuitive finding that classifying individual buildings from satellite imagery introduces significant bias at regional scales, the team used Earth observation data to identify distinct development patterns such as dense urban cores, sparse rural settlements, and mixed-use neighborhoods instead. Within each pattern type, engineering experts characterized the dominant construction practices, drawing on regional knowledge to ensure the baseline reflects how buildings are actually built and how they are likely to perform when disaster strikes.
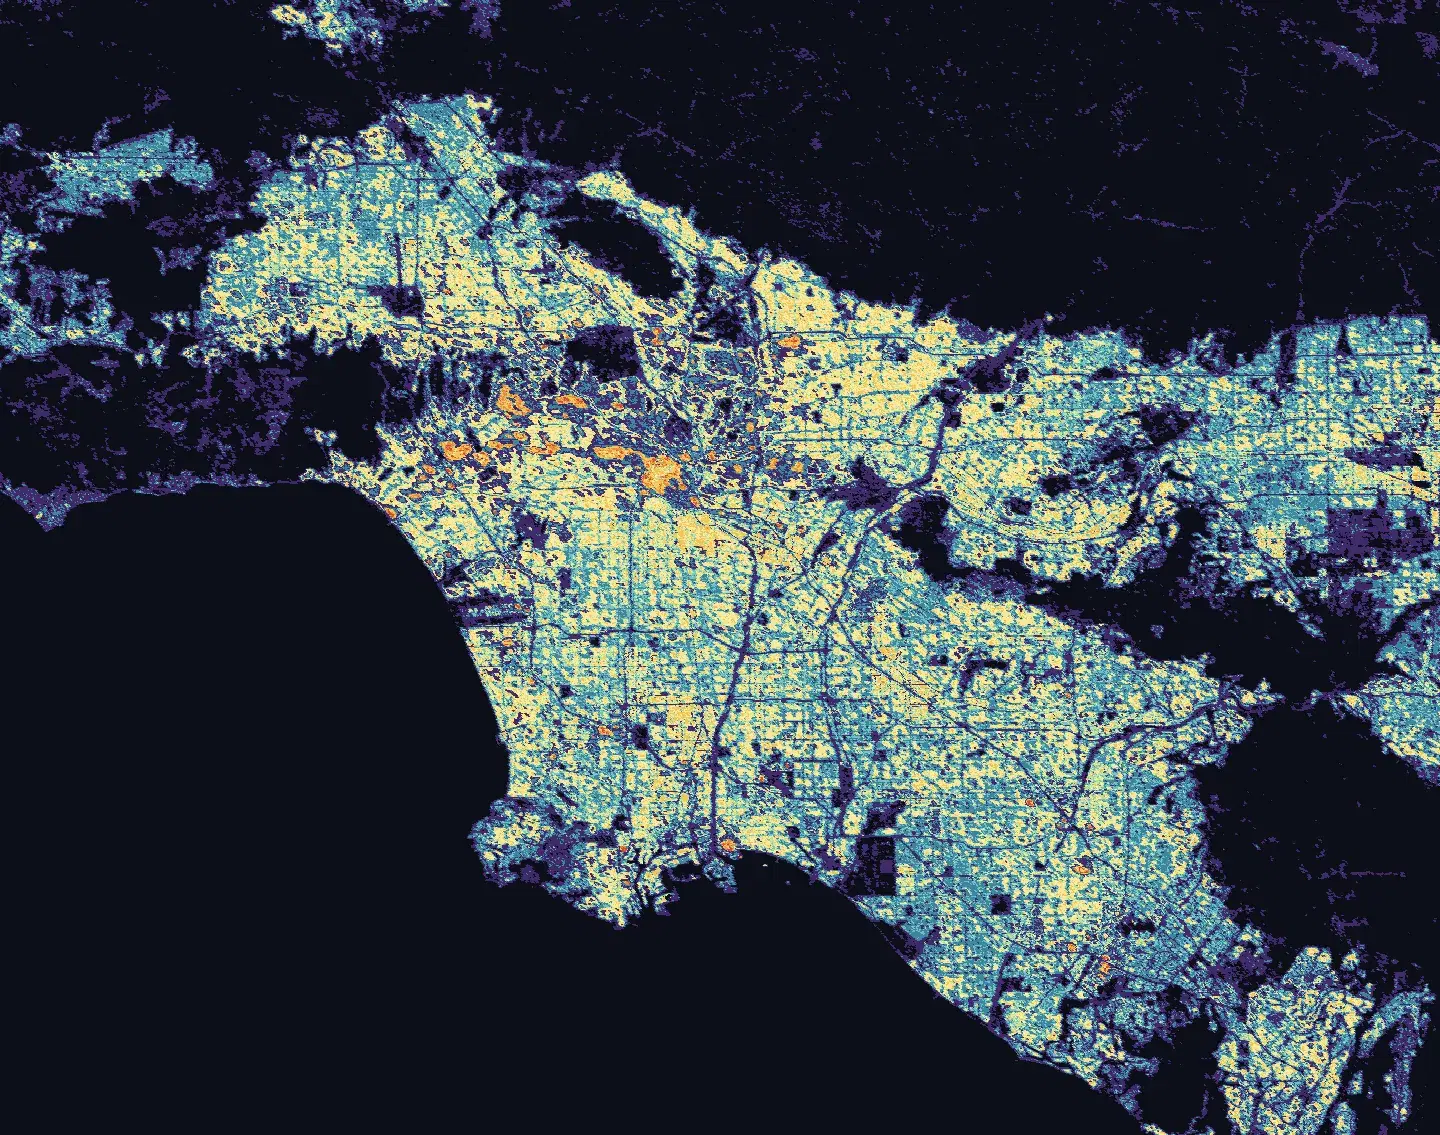
The resulting dataset, GAIA, aggregates building exposure on a 100-meter grid, estimating building counts and floor area by construction type and height – giving recovery planners worldwide a consistent purpose-built foundation for understanding what stood in harm's way and what it would cost to rebuild.
But rebuilding cost is only part of the picture. When a hospital loses power, a distribution center shuts down, or a neighborhood's small businesses close for months, economic disruption can far exceed the cost of the physical damage itself. GEDI addresses the question traditional loss models have left largely unanswered: How long is recovery likely to take? Connecting Earth observation data, infrastructure exposure, and economic modeling, GEDI translates that analysis into a clear, actionable scale, from slight impacts resolved in hours to catastrophic disruption requiring years of recovery.
GEDI can be used along with information, such as USGS and NOAA advisories, to help agencies quickly determine whether a disaster is likely to stymie long-term economic growth or whether disruption is expected to be short-lived. When resources are being allocated and timelines are being set, that’s a critical distinction.
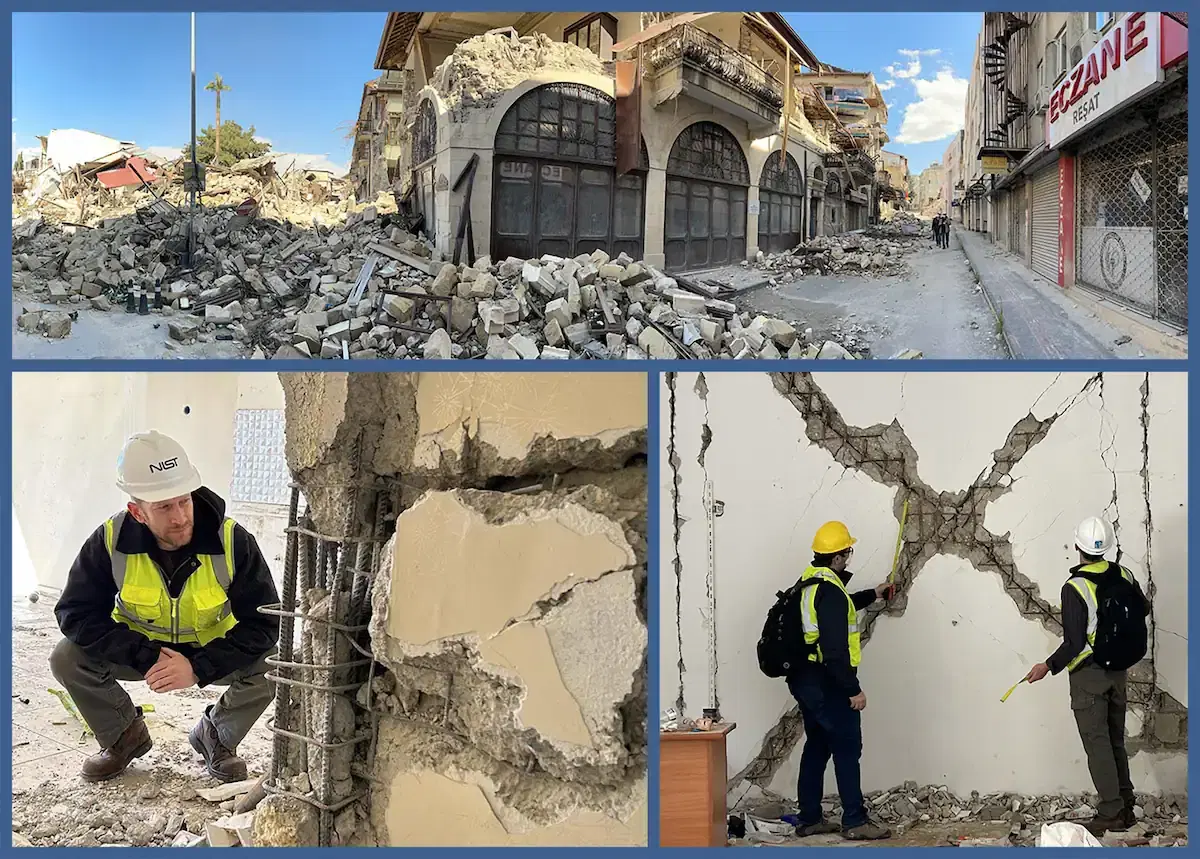
GAIA and GEDI each give decision-makers a rapid, defensible gut check before physical assessors arrive. That the UK Space Agency and the World Bank have independently invested in this work reflects confidence in a methodology tested across diverse geographies and construction environments.
Building a Foundation Others Can Build On
GAIA modeling data is now available through the NASA Disasters PORTAL (Partnership-Oriented Resource for Training, Analysis, and Learning) and through the EU Joint Research Centre's Human Planet initiative, giving governments and institutions worldwide access to risk-ready building exposure data as a standard part of recovery planning.
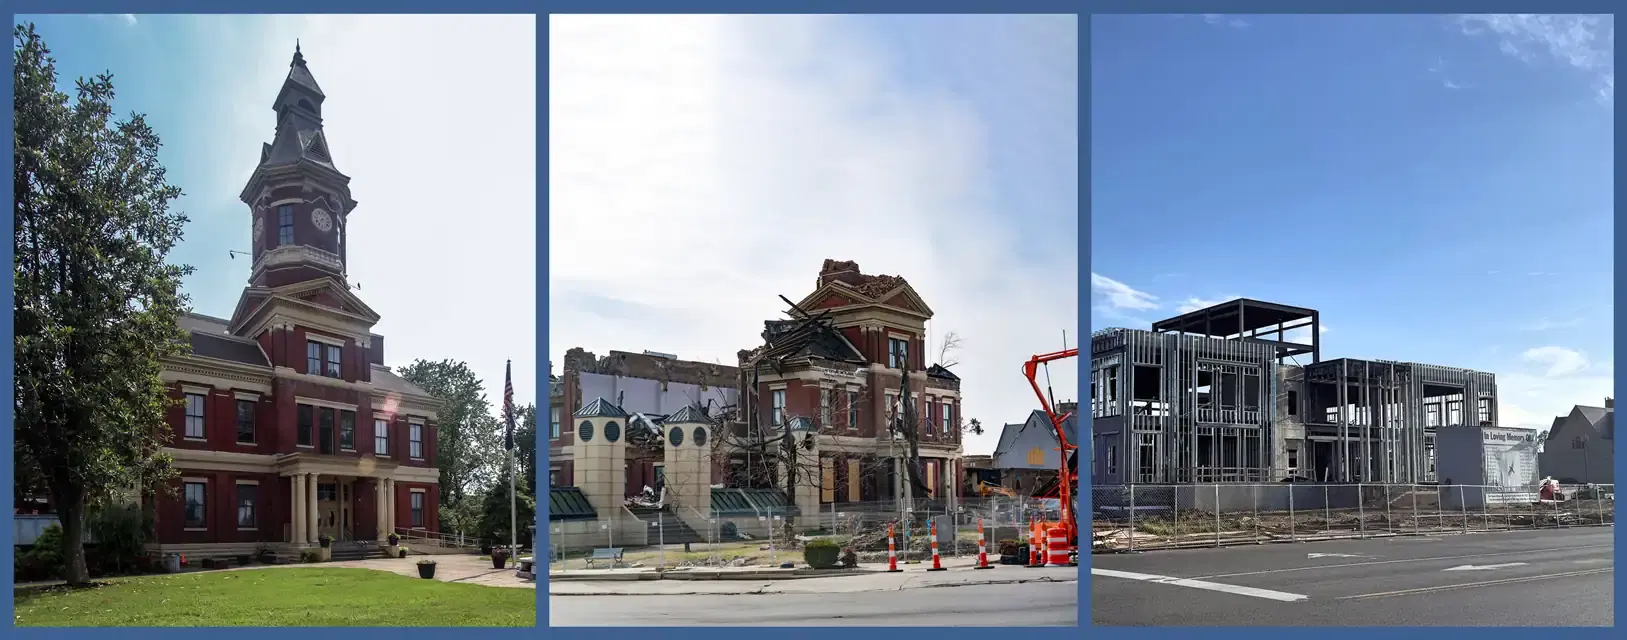
How a community rebuilds determines how much risk it will face the next time a hazard strikes. Recovery decisions made under time pressure and incomplete information, including where to rebuild, what standards to require, and which infrastructure to prioritize, shape a community's exposure for decades. Tools that provide a more complete initial picture of damage extent, rebuilding cost, and projected economic disruption don't just support faster recovery decisions. They support better ones – decisions more likely to reach the vulnerable communities that existing data most often leaves behind.
These tools are already informing decisions in practice. GEDI's economic disruption modeling has informed investment strategies for major public funds, supported community resilience planning, and is being used to inform parametric insurance products that extend financial protection to governments and institutions in disaster-prone regions.
The long-term goal is simple: ensure that every government and institution responsible for recovery planning has what it needs to make better decisions. For the first time, that includes purpose-built tools designed to help answer the questions that matter most to the people waiting for recovery to begin – what rebuilding will cost, and how long it will take.
Cornerstones
- Recovery decisions shape future risk. How a community rebuilds determines how much risk it will absorb the next time a hazard strikes. Acting on incomplete damage and loss information may inadvertently restore the same conditions that made a community's situation worse in the first place. Better tools don't just speed up recovery. They improve it.
- Not all damage data is recovery-ready. The datasets most commonly available after a disaster were built for administrative purposes, not risk assessment. When used to estimate losses or allocate resources, they can introduce compounding bias that distorts every decision that follows. Decision-makers should expect purpose-built tools, not data repurposed for objectives it was never designed to meet.
- The third question is the most consequential. Where did it happen? What did the physical damage cost? These two questions are typically answered quickly. How long economic disruption will last has historically gone unanswered until well into the recovery process – a gap that carries real consequences for decision-makers allocating resources in the immediate aftermath. These tools are designed to narrow that gap before critical decisions are made.