When the Next Flood Hits, Will Your City Be Ready?
Sea Level Rise Meets Sinking Land in a Region the Nation Depends On
What will it take for your city to withstand the floods of the future, not just the ones it’s already survived?
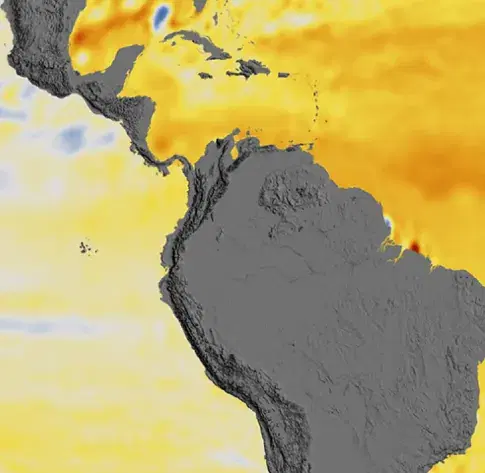
In Hampton Roads, Virginia, that question is more urgent than almost anywhere else in the U.S. Home to more than 1.7 million people, the region sits low against the Chesapeake Bay and the Atlantic, where sea levels are rising faster than the national average and the ground itself is sinking beneath it. And the stakes reach far beyond local residents: Hampton Roads is home to Naval Station Norfolk, the largest naval base in the world, and the Port of Virginia, one of the busiest container ports on the East Coast. A major flood here can disrupt national defense logistics and ripple through supply chains nationwide.
Highlights
- Hampton Roads faces compounding threats that overwhelm flood defenses all at once. Rising seas, sinking land, and storms that combine surge, rainfall, and saturated ground create flood conditions far worse than any single hazard would produce alone.
- Modeling past storms helps plan for future risk. Studying what historic storms would look like in 2050 is helping planners understand what’s coming and what mitigation steps matter most.
- Local partnership makes the science actionable for real decisions. By combining local infrastructure data with NASA’s modeling, the project is putting flood-risk tools directly into the hands of planners, emergency managers, and communities.
The combination of rising water and sinking land breaks an assumption many existing flood plans make: that current flood zones and elevation maps are a reliable guide to future risk. Many of the flood models available to planners today weren’t built to track that changing complexity, and fewer still can show risk at the resolution that actually matters for decision-making: down to individual streets, parcels, and neighborhoods.
“When I joined NASA in 2009, watching Nor’Ida flood the city around me made it clear that we needed a better way to plan for what was coming, not just what we’d already seen,” says Patrick Taylor, scientist at NASA’s Langley Research Center in Hampton Roads.
Through the NASA Disasters Program’s Hampton Roads Coastal Resilience project, Taylor and his team are looking to the past to build resilience for the disasters of the future – and the tools and techniques they’re developing can help flood-vulnerable communities across the country.
From Four Historic Storms to the Floods of 2050
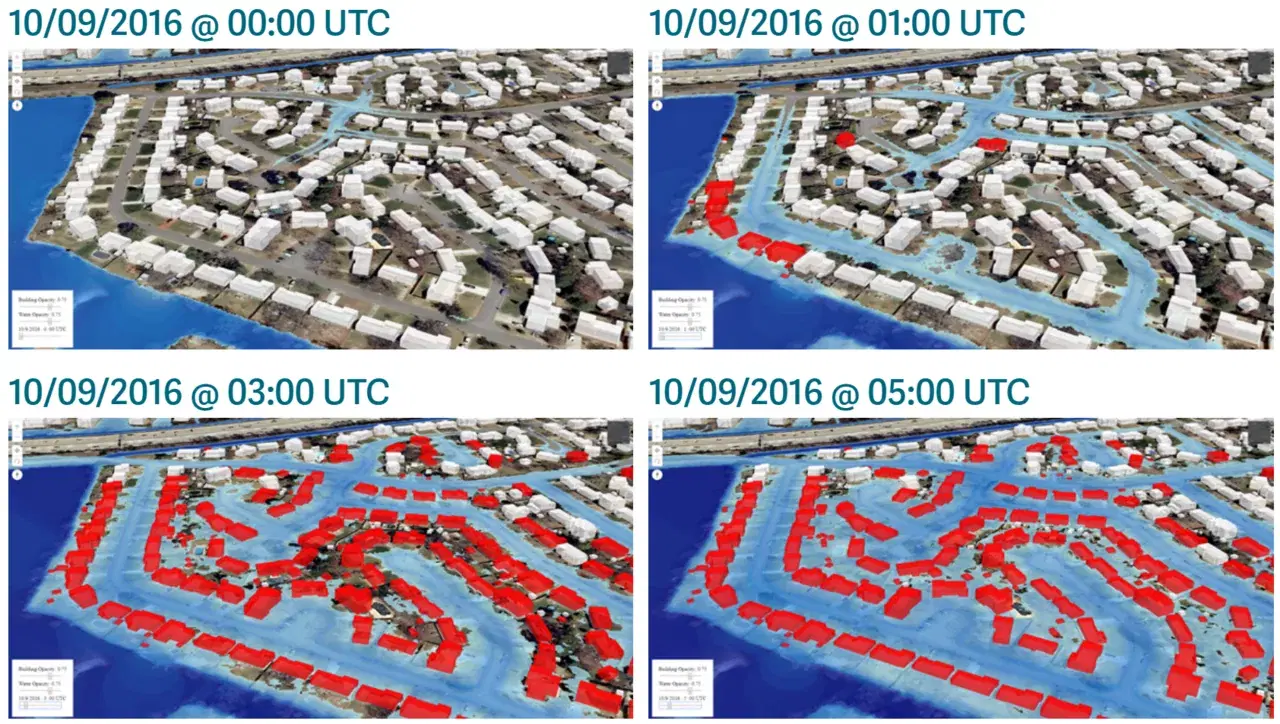
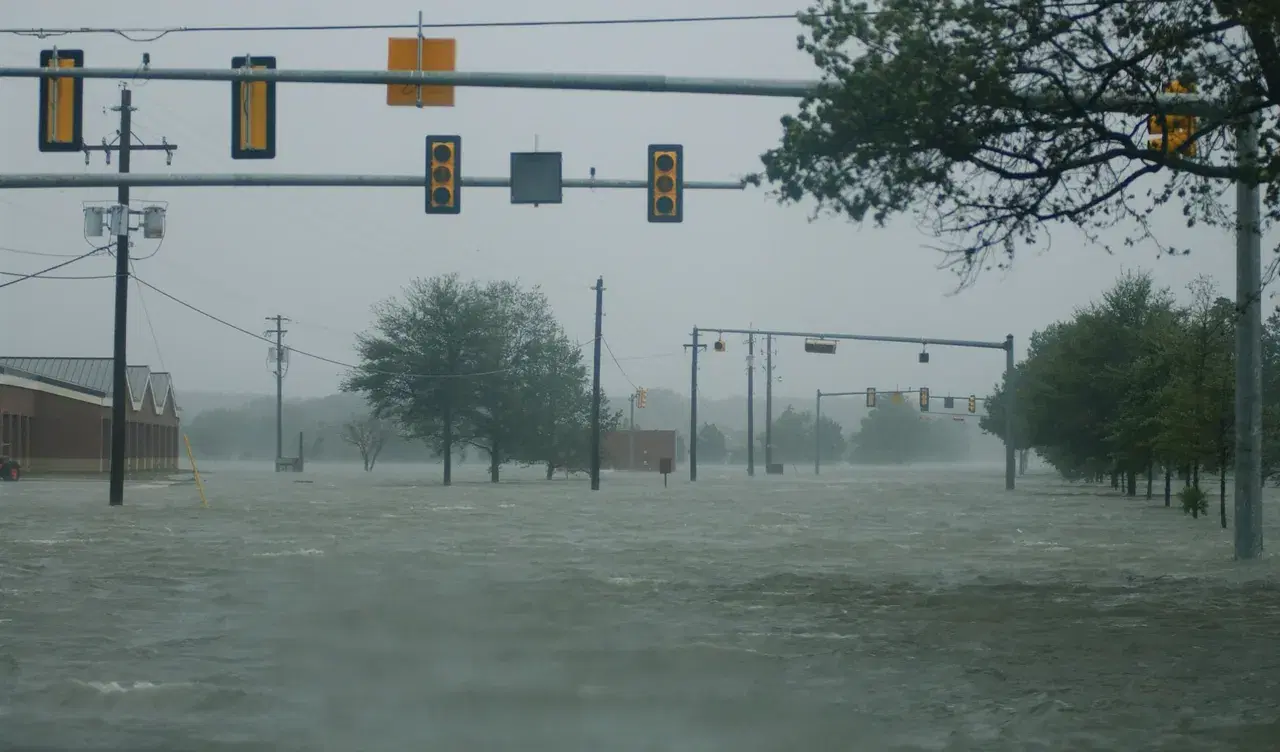
On October 9, 2016, Hurricane Matthew pushed floodwater through Virginia Beach after days of rain had already saturated the ground. Using advanced modeling, the Hampton Roads Coastal Resilience team reconstructed that day almost as it happened – not as a single snapshot, but as it unfolded hour by hour.
These detailed street-level flood maps turn the data into something regional planners can learn from: not just where water eventually stood, but how it got there – which streets flooded first, how fast water rose block by block, and how long it lingered before receding.
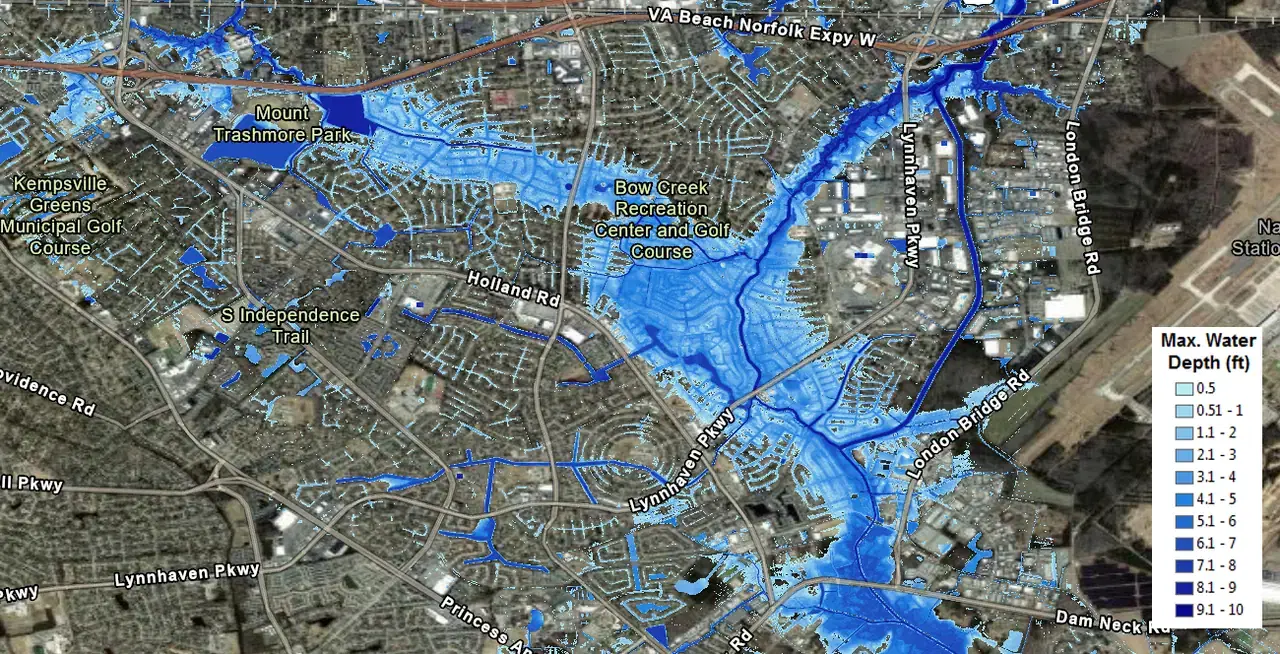
That same modeling capability is now being pointed toward the future. Matthew is one of four historic storms the team is putting through the same test, studying what would happen if that storm struck Hampton Roads again in 2050, after up to 1.5 feet of projected sea level rise and years more of coastal development. The team is using those scenarios to project how familiar storms could produce unfamiliar floods. It’s a preview the region can study today to make decisions that mean less damage when the next storm hits.
Putting NASA Science in Your Hands
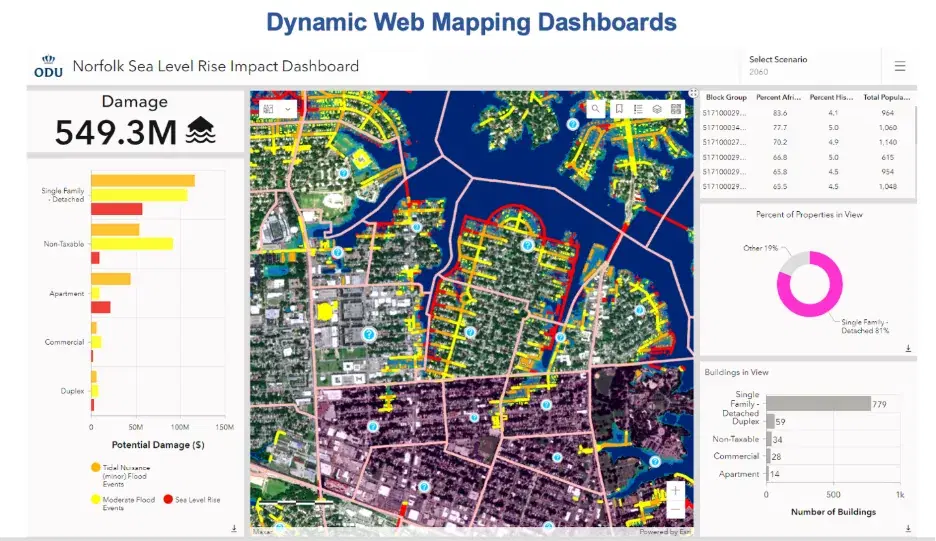
For this science to matter, it must reach the people making real decisions in a way they can quickly use. Old Dominion University is leading an integration with the VA CORES dashboard, bringing the project’s flood maps together with infrastructure data and social vulnerability metrics in one place. With this tool, Hampton Roads planners can explore future flood risk down to the parcel level to shape mitigation strategies and emergency response plans.
“NASA’s satellites, airborne platforms, and models give us data no one else has,” says Taylor, “but just as important is the power to convene cities, universities, and community groups to the same table around a problem too large for any one of them to solve alone.”
That collaboration is already informing real decisions on the ground, from where stormwater infrastructure gets upgraded to where nature-based defenses like marsh and wetland restoration make the most sense. They’re the kind of decisions your own community may be weighing right now, and NASA science can help you make them.
If you’re a planner, emergency manager, or researcher working to protect your own coastal community, the resources below can help you get started.
Cornerstones
- Compound flooding requires compound modeling. Real floods rarely come from a single source. When storm surge, heavy rainfall, and saturated soil combine, the damage far exceeds what any single hazard would produce. Models that simulate these interactions give planners a more accurate picture of risk than traditional single-driver approaches.
- Meter-scale resolution transforms how planners use flood models. When models show flood risk parcel by parcel, planners can evaluate specific infrastructure investments, compare mitigation strategies neighborhood by neighborhood, and communicate risk in terms residents recognize.
- Regional cooperation builds resilience no single city can achieve alone. Hampton Roads is stronger when neighboring cities share infrastructure data and coordinate recovery planning rather than working independently.
- Effective resilience planning serves all phases of the disaster cycle. Understanding how hazards interact with infrastructure and affect communities differently based on exposure and vulnerability helps cities prepare for disasters, respond effectively when they strike, and recover faster afterward.